(This article was updated on June 3, 2024 to include evidence on the effectiveness of Transparently.AI's solution in detecting and measuring accounting fraud.)
Artificial intelligence (AI) is proving increasingly valuable in the task of detecting and preventing fraud, but it’s in the field of accounting fraud where AI really shines.
One in 10 public companies are thought to commit securities fraud each year and virtually all manipulate their financial statements to some degree. Most do it to give the appearance that a company is worth more than it is. Some do it to manipulate their stock price.
Whatever the reason, if we extrapolate the estimated cost of accounting fraud in the US to the entire world, the annual cost of accounting fraud to the global economy is at least US$1 trillion. It’s a number that we have quoted often, elsewhere. Putting that number in perspective, the world consumes about US$3 trillion worth of crude oil per year.
So, accounting fraud matters and we haven’t even considered the indirect costs due to the resultant misallocation of resources. Some researchers have even found that a build-up of misreporting can lead to a recession or lower economic growth through its real effects.
This article looks at how AI can be used to detect - and therefore mitigate - accounting manipulation and fraud. To illustrate the concepts, we've included an explanation of how our AI-powered tool detects such malfeasance.
Accounting fraud is invisible
Accounting fraud is insidious because, like an iceberg, it is mostly invisible. It involves non-cash transactions embedded deep in a company’s financial accounts. Other forms of criminal fraud, by way of contrast, are transactional.
Transactional fraud is quickly discovered. If a chap on the streets of Paris sells you the Eiffel Tower, you will very quickly discern you are not the true owner, even if you drink pastis and wear a beret.
Relative to the known prevalence of accounting fraud, therefore, most accounting fraud goes undetected. Even when detected, admission of guilt is rare and criminal charges even rarer.
In the whole of 2022, the US Department of Justice tried just 72 individuals for fraud and convicted 56 at trial. Only one case of accounting fraud led to incarceration, that being Frank Okanuk, the former CFO of the PR firm Weber Shandwick. Of course, FTX was the big accounting fraud case of 2022, but even here it appears the authorities will press charges relating to embezzlement rather than account manipulation because accounting fraud is so darned hard to prove.
Red flags in traditional accounting
Although accounting fraud is difficult to prove, it can be detected via an array of forensic accounting techniques. These techniques are essentially anomalous patterns in a company’s reported financial numbers or in its governance.
These anomalies are known as “red flags." The greater the number of red flags, the greater the likelihood a company is cooking the books.
Examples of accounting anomalies include:
- Strong revenue growth without corresponding growth in cash flows;
- Abnormally high accruals or capitalization of expenses in relation the size of the balance sheet;
- Unnaturally smooth earnings;
- Inverse correlation between operating cash flow and operating profit;
- Solid sales growth while competitor sales are struggling;
- Depreciation rates that don't correspond to the standard rates in a company’s industry;
- Outsized frequency of complex third-party transactions, many of which add intangible rather than tangible value;
- Frequent asset write-downs;
- Unseasonal improvement in a company's performance within the final reporting period of a fiscal year;
- Frequent re-statement of earnings;
- Unusual discretionary expenses.
The greater the number of red flags, the greater the likelihood a company is cooking the books.
These and hundreds of other accounting anomalies can be used to detect potential accounting fraud. Some, such as those shown here, are simple while others involve complex ratios or lengthy computations.
Other indicators of potential accounting fraud rely not on financial statements, but on markers of poor corporate governance or business manipulation. This might include:
- Employing a little-known auditor;
- Replacement of an auditor resulting in missing paperwork;
- Lack of audit or other relevant committees;
- Disproportionate management compensation derived from bonuses based on short-term targets;
- Disproportionate compensation of management via options.
Problems with traditional accounting
A seasoned forensic accountant uses red flags for accounting and governance concerns to build a detailed picture of the extent of anomalies in a company’s financial accounts. From this picture, they will be able to provide an assessment of the risk of fraud at a particular company.
This approach faces two problems:
- First, it takes time and good forensic accountants do not come cheap. This is fine if we are assessing one or two companies, but what if we want to examine hundreds?
- Second, how do we analyse the data? How do we put all these red flags together in a coherent way so that we can get an overall estimate of the risk that a company is manipulating its accounts? How can we compare one company with another? How can we compare companies in different industries, or across different countries? Accounting standards vary widely among industries and countries.
This is a complex problem. It is a big-data problem that frankly lies beyond the scope of the human brain. It is also a significantly more complex problem that we encounter with regular transactional fraud. In this case, the same patterns endlessly repeat and it is a relatively simple matter to build algorithms to detect anomalies.
However, companies are unique. A company’s business model, its products, its markets, its work force and its assets will be unique. Its approach to discretionary accounting decisions will also be unique. Accounting relationships that might be highly anomalous in some industries might be perfectly natural in others.
How can we compare companies that are unique in almost every respect? The answer, of course, is AI.
What is machine learning?
AI technologies are tailor-made for the detection of accounting fraud because they are able to analyse large volumes of data to detect patterns and anomalies which can be used for prediction.
AI, in this instance, refers to machine learning (ML) algorithms, which are a subset of AI.
An algorithm is a coded formula written into software that is designed to solve specific problems. The programmer details the problem and the data needed to solve the problem. The system analyses the data to deliver a solution.
In this case, the problem is to find patterns of data that have been associated with particular outcomes. The ML algorithm uses these associations or patterns to create models which can be used to forecast the probability of certain events such as the probability that a company is manipulating its accounts.
Machine-learning algorithms automate the process of finding patterns in data. As new data becomes available, the algorithms learn and adapt continuously.
The key with AI is that these predictive models are not fixed. Machine-learning algorithms automate the process of finding patterns in data. As new data becomes available, the algorithms learn and adapt continuously.
They require less human involvement over time and are able to deliver increasingly effective analysis. The entire system is constantly learning as fresh data is introduced or as some data restrictions imposed by the programmer are relaxed. When applied to previously unused data, the model can be used to anticipate patterns in that data. This process allows the user to test the accuracy of the machine-learning system.
AI system to detect accounting fraud
The AI system underlying the Transparently.AI Manipulation Risk Analyzer (MRA) is trained to look for patterns associated with accounting manipulation and various types of fraud. It does this by identifying these patterns in known historic cases of serious accounting manipulation, fraud and resulting corporate failure.
Although every past case of fraud is different, the relationships among accounting variables are constant. Thus, even though different strings are pulled when accounts are manipulated, similar anomalous patterns in the relationship among accounting variables will result.
These patterns are not linear and they are not necessarily obvious to the naked human eye, but they are present in the complex models woven by the machine learning algorithms.
The MRA allows the user to analyse hundreds or even thousands of companies in a single session, and thus can greatly facilitate the avoidance of potentially fraudulent companies.
How our AI system finds and rates corporate accounting fraud
Transparently.AI provides a risk score, rating, and full forensic report for every listed company worldwide (minus a few exceptions) for every fiscal year since the early 1990s. The solution, which replicates the practices of forensic accountants, short sellers, credit analysts, and academia, is entirely dynamic: It constantly identifies new patterns of manipulation and applies its learnings to all companies.
The company has built a vast array of diverse financial models (around 200) into the MRA, which are designed to replicate the processes and practices of forensic accountants, activist short sellers, credit analysts, equity analysts and auditors. In addition, the system is designed to identify patterns of behaviour that would never typically be considered by these industry participants as well as research by professional academics.
The solution is entirely dynamic: It constantly identifies new patterns of manipulation and applies its learnings to all companies.
The MRA sifts through millions of publicly available corporate financial data points to deliver an A+ to F rating and a 0-100 percentage score that together articulate the extent of a company's accounting malfeasance, along with the probability of it collapsing as a result.
The MRA then delivers an automated 10-50+ page custom report for any of these companies and any financial year in seconds, identifying all the suspicious activities the system has uncovered, information on what to do next, data points to get you started on your investigation, what questions to ask, and more.
Harnessing the power of AI, Transparently.AI has condensed a process that takes a team of analysts weeks or months into a tiny fraction of that time.
The success rate of our system
We have tested the efficacy of the Manipulation Risk Analyzer using a dataset of more than 60,000 stocks in 126 countries over the 30-year period from January 1994 through to June 2023. Half of this data was used to train the engine. The other half was used for out-of-sample testing. The results are impressive.
Figure 1 provides a partial confusion matrix data for the in-sample (the data we used to train our system) and out-of-sample (the data we used to test our system) datasets. In machine learning, a confusion matrix is simply a table that is used to illustrate the performance of an algorithm.
Figure 1: The success rate of the MRA in predicting fraud and subsequent failure
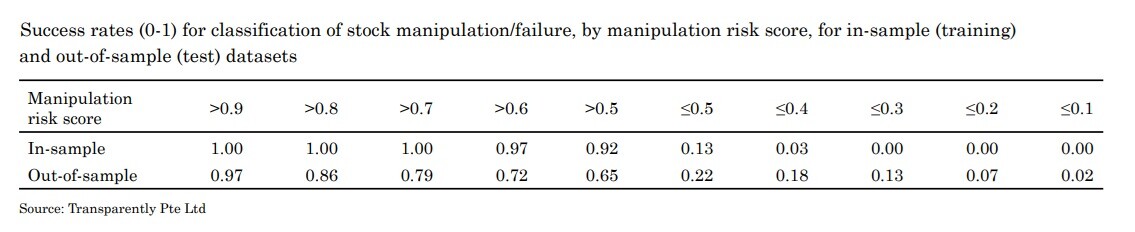
As noted, the tool is trained to identify the probability of accounting manipulation and subsequent corporate failure. One obvious indication of corporate failure is a collapse in the share price. In this context, we define failure as relative and absolute stock performance of -80% or worse from a stock’s historic peak price.
Moving from left to right, the table illustrates the ability of the MRA to predict failure based on the manipulation risk score allocated by the system. Column 1, for example, considers companies with a manipulation risk score greater than 90%. These are companies that the risk analyzer estimates to have a 90%+ joint probability of manipulation leading to failure. Column 3 considers companies estimated to have a 70% chance or higher of failing.
The first row of results shows the in-sample performance. The table shows that 100% of companies with a risk score greater than 90% failed. Indeed all companies with a risk score above 70% also failed. The in-sample performance is nearly perfect because the system was trained on this data.
The second row illustrates the performance when we apply the estimated model to the out-of-sample, or test, dataset. When the predicted manipulation/failure probability is 90%+, in fact 97% of the test set met the failure criteria. Looking at column 3 we find that 79% of stocks with a risk score in excess of 70% subsequently failed.
Remember, failure means the stock price fell at least 80% in both relative and absolute terms. For companies with a risk score in excess of 50%, roughly two thirds subsequently saw their stock prices collapse.
The key result here is that as the predicted manipulation probability declines, the proportion of actual failure monotonically declines. There is a very strong relationship between risk scores and the probability of stock failure. Hence, a higher manipulation probability implies higher certainty over the presence of manipulation and subsequent stock failure, and vice versa for lower manipulation probabilities.
How our system performs over shorter time periods
Figure 2 repeats the exercise in Figure 1 but imposes a time constraint so we can see how the system performed over these defined time periods.
Section A examines the success rate of the system in cases where stocks are 1 year before hitting the failure event threshold. In this situation, we can see there is still a strong monotonic relationship in the out-of-sample test set between predicted manipulation and later failure. For example, a predicted manipulation/failure probability of 70% is associated with 80% of those stocks ultimately meeting the failure threshold within a year.
Figure 2: The success rate of the MRE over defined periods
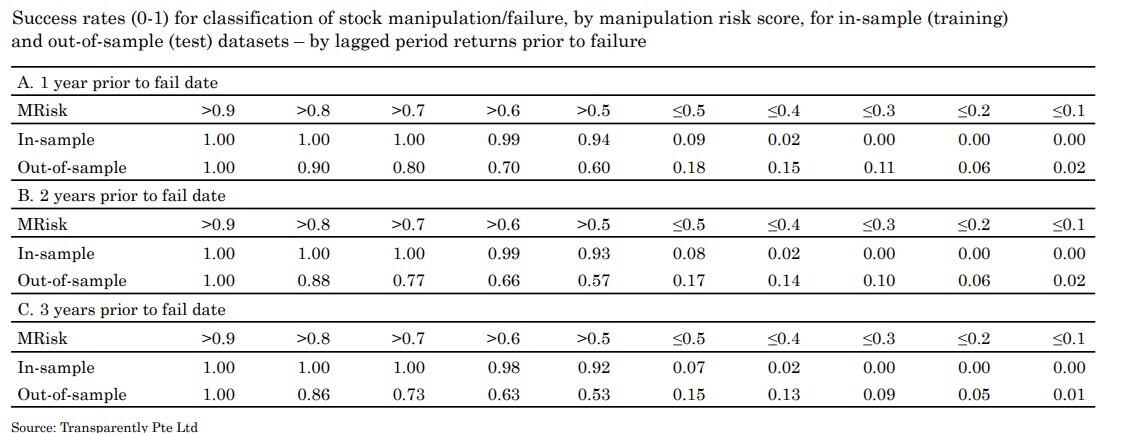
Panels B and C provides similar results for stocks 2 and 3 years before failure, respectively. In many cases, the 3-year results projected failure before the stock price had even peaked. In other words, our system typically finds problems before there is any market recognition of issues whatsoever.
What the risk scores mean for an investor
This knowledge is useful if you're investing in listed equities, and the time periods we used above are relevant since most investors have an investment horizon of 1-to-3 years.
Many investors believe the key to investing is finding stocks that will outperform. But, while a 5-bagger will do wonders for portfolio returns, the fact is that stocks that suffer grievous losses are vastly more common than 5-baggers.
In our sample of over 60,000 stocks, we found that in the period from January 1994 to June 2023 some 35% of companies that listed subsequently delisted. Some delisted due to M&A but the majority delisted due to failure.
We know this because the median absolute return from peak to delisting price of all delisting stocks was a whopping -74.9%. The median relative return was -95.3%. Thus, delisting is typically associated with something approaching a near total loss in equity value from a stock’s peak.
Viewed in this light, the key to successful investing is mostly about avoiding companies destined to fail. This is where the Transparently.AI risk engine comes into its own.
The key to successful investing is mostly about avoiding companies destined to fail. This is where the Transparently.AI risk engine comes into its own.
Figure 3 highlights the relationship that investors really care about: the relationship between the estimated risk scores and future stock returns.
The full stock universe is split into risk groups and median returns are calculated for the 12-month financial year after the year generating the risk score. We can see a perfect monotonic relationship between each risk bucket and future returns for both the training and test datasets.
Figure 3: Manipulation risk versus 12-month stock returns
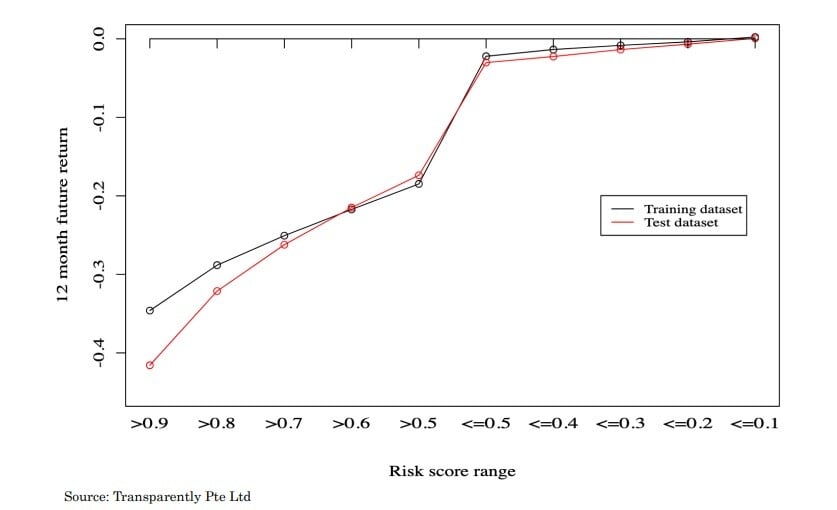
As we have already learned, a high risk score is associated with substantial losses. Here we also see that lower risk scores are associated with better future outcomes. The difference between median future annual returns for risk scores >0.9 and risk scores <0.1 is 34.8% for the training dataset and 41.2% for the test dataset. These are extremely large differences.
Applications of the system in real life
For those wishing to see real-life examples of how the Transparently.AI risk engine can be used, we recommend reading some of the examples in our blog posts.
Of course we cover some very famous examples of companies that have collapsed due to fraud, such as Enron and Wirecard, but we also illustrate some very recent examples such as Country Garden and Alstom.
In May of 2023 we highlighted the parlous risk scores of the Chinese property developers. In August we looked at Country Garden and noted that the company looked terrible on the Transparently risk engine as far back as 2019, when it also was in the worst decile of companies globally for account manipulation risk. This was well before anyone imagined the company might default. In fact, the system even had problems with Country Garden as far back as 2010.
With Alstom, the system gave the company a risk score in the 90th percentile globally. It flagged serious concerns about asset quality, corporate governance, income quality and, importantly, cash quality. Moreover, the system found numerous anomalies that were later to prove highly significant as the company ran into trouble.
Conclusion
Traditional methods of detecting fraud are often time-consuming and costly, and many instances of fraud go undetected or unprosecuted.
However, AI-powered solutions like Transparently.AI's MRA have the potential to revolutionize the detection and prevention of accounting fraud, offering a more efficient and effective approach compared to traditional methods.
AI algorithms continuously learn and adapt as new data becomes available, improving their accuracy over time. With the ability to analyze vast amounts of data and detect complex patterns, AI is a powerful tool in safeguarding against accounting fraud and promoting financial integrity.
Tested in a robust manner, the system demonstrates a remarkable ability to identify companies that are likely to fail and can be an indispensable tool for investors.
Return to top