.jpg)
The prospect of juicy returns lures many investors to the world of high-yield credit investing.
High-yield bonds, also known as speculative-grade or "junk" bonds, are securities with investment grades BB+ or lower. These bonds promise outsized yields relative to government bonds but come with a nasty bite: elevated risk of default and scandal. These travel in close company because failing companies typically cannot afford the higher interest cost associated with yet another ratings downgrade. Put simply, they are strongly motivated to manipulate their financial numbers to ensure continued funding and to avoid even higher borrowing costs.
Remember Enron or Wirecard? Manipulators such as these can torch a credit portfolio, erasing the yield advantage over government bonds or worse. This elevated risk, often masked in diversified products, presents a particular challenge for investors relying on passive vehicles like high-yield ETFs.
To overcome the limitations of traditional credit analysis - specifically, the challenge active managers face in anticipating defaults and downgrades due to the sheer volume of issuers and the hidden nature of accounting manipulation - this article introduces a powerful AI-powered solution: One that predicts 'corporate collapse' with high accuracy years in advance.
We will demonstrate how artificial intelligence can fundamentally enhance high-yield credit strategies, enabling funds to both significantly reduce portfolio risk and systematically generate alpha. But first, some background.
The problem with speculative grade ETFs
The risk is real. The average annual issuer-weighted 1-year default rate for global speculative-grade corporate bonds in the period from 2000 to 2024 was 3.65%, according to Moody's latest Annual Global Corporate Default and Rating Transition Study.
In a recession, when the average investor can least afford a setback, default rates on speculative bonds typically exceed 9%. But this is only part of the story. According to S&P Global Ratings' 2024 Annual Global Corporate Default and Rating Transition Study, the long-term average (1981-2024) shows a downgrade rate of 11.31% versus an upgrade rate of 8.41%, yielding a downgrade/upgrade ratio of 1.58.
This tendency towards deterioration among speculative grade bonds equates to a constant upward jump in yields and a decline in price for about 3% of the universe on average.
Figure I: Annual downgrade rate for speculative grade bonds (2020-2024)
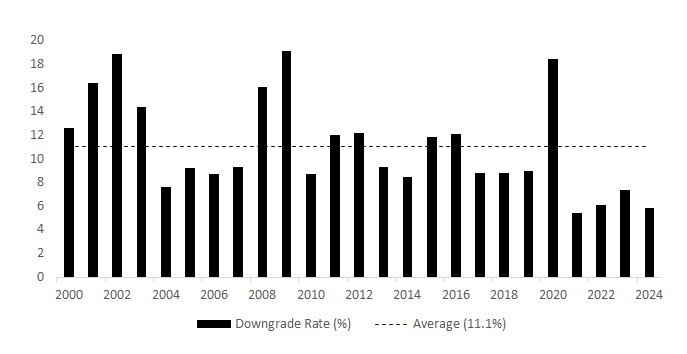
What this means, in layman's terms, is that unless the yield on your high yield ETF exceeds that on government bonds by 400 basis points or more, you are unlikely to significantly outperform a government bond ETF. If the economy enters a rough patch, you will significantly underperform.
This problem is well known, which is why many prefer high-yield funds run by an active manager. Unfortunately, like their equity market brethren, active high-yield managers do not outperform passive funds. Comprehensive data from S&P Dow Jones Indices' SPIVA U.S. Scorecard for Mid-Year 2025 show that the vast majority of active high-yield funds underperform benchmarks such as the iBoxx $ Liquid High Yield Index across most time horizons.
The SPIVA results indicate that active bond managers are not good at avoiding defaults, nor good at anticipating upgrades and downgrades. This is understandable because credit funds are typically run by small teams that must cover hundreds of issuers, each with multiple bonds under their name. The iShares iBoxx $ High Yield Corporate Bond ETF (HYG), for example, has over 1,300 holdings from 518 unique issuers. How can a small team sift through so many names?
The Transparently.AI solution
Fortunately, there is a solution. Transparently.ai's risk index (specifically, its 0-100% risk score) functions as a default prediction tool. It is the perfect instrument enabling fixed income investors to assess both default risk and downgrade/upgrade risk in corporate bonds.
While primarily marketed as a forensic accounting system for detecting earnings manipulation, the system’s methodology and validated performance explicitly incorporate forward-looking predictions of "corporate collapse" - a term that aligns closely with default events like bankruptcy, restructuring or failure to service debt.
The Transparently Risk Index (TRI) calculates the joint probability of accounting manipulation (e.g., aggressive revenue recognition or off-balance-sheet hiding) and subsequent collapse. It draws from 200 financial models analyzing 14 risk clusters (e.g., accruals quality, cash flow anomalies, governance issues) across 85,000 global companies' statements. It works because account manipulation often serves as an early indicator of underlying distress - companies inflate earnings to mask liquidity stress or overleverage, symptoms which precede defaults by 1-3 years.
In credit modeling terms, this mirrors components of Probability of Default (PD) frameworks like those in Basel III, where qualitative red flags amplify quantitative signals (e.g., Altman Z-Score). In fact, there is complete methodological overlap except that standard PD frameworks naively assume that corporate accounts are always completely honest. Imagine if police prosecution only relied on the testimony of suspects.
Empirical evidence
The proof, as they say, is in the eating.
The Transparently.ai engine predicts corporate collapse with over 90% accuracy up to three years in advance, with near-zero false positives. This far surpasses traditional methods, which typically have not much better than a 50% hit rate.
"Collapse" here implies severe financial failure, directly relevant to defaults, as it encompasses events where firms can't meet obligations (e.g., bond covenant breaches or Chapter 11 filings). This isn't mere hindsight; the models are trained on decades of historical data, including fraud-to-failure cascades like Enron or Wirecard.
The results quoted above are not based on back-tests, but rather based on point-in-time (PIT) analysis between 1999 and 2025. PIT analysis provides a "snapshot" of the data as it was on a particular date, which is crucial for reliable historical analysis and consistent reporting.
PIT analysis examines performance as it would have occurred in real time. This differs from traditional backtesting which uses a static snapshot of historical data, which is often "restated" or "backfilled" with the latest information available at the time of the backtest. This approach is highly susceptible to look-ahead bias (or information leakage), where the backtest inadvertently uses future information to make simulated decisions in the past. This can paint an unrealistically optimistic picture of a strategy's performance.
The PIT analysis shows high TRI scores strongly correlate with negative future returns: at the 80th percentile threshold, high-risk firms have averaged global US dollar 12-month returns of -20.2% since 1999 versus +2.6% for the rest of the market. A strategy shorting high-risk stocks and longing low-risk ones outperformed the S&P 500 by 2.5x over the period.
In short, our results are proven with a real-world, 'no cheating' test, unlike many competitors' back-tests.
Why this matters for fixed income
These equity market results translate directly to credit returns as distressed firms trade at widening spreads as their equity valuations fall. Distress trajectories in the equity market lead to credit downgrades that culminate in defaults. This explains the TRI’s utility in avoiding default-prone issuers.
In bond portfolios, defaults and downgrades erode principal (e.g., ~5% annual loss rates in high-yield). Meanwhile, upgrades enhance principal (e.g., ~1% in high yield). Early detection via accounting forensics can preserve returns.
Transparently.AI's engine isn't your grandpa's spreadsheet audit. Trained on vast datasets of historical financials, it deploys machine learning to dissect 10-Ks, earnings calls, and cash flow statements in hours, not months. The output? A crisp 0-100 risk score (higher means hotter red flags) paired with an A+ to F grade, quantifying the probability and severity of earnings inflation, revenue recognition tricks, or off-balance-sheet hides. It is digital forensic accounting, flagging anomalies like aggressive lease accounting or channel stuffing that signal impending distress.
For high-yield managers, this is gold: traditional credit ratings from Moody's or S&P often lag, missing the "soft" signals of manipulation that precede downgrades.
This enhances a high-yield credit ETF or bespoke portfolio in three ways:
- Superior screening: In a universe of 1,300+ issuers, the TRI scores let you cull the truly toxic. Avoid bonds from E- or F-rated manipulators - those with scores above 80%, where failure odds spike 5x per Transparently's PIT analysis - and redirect capital to B/BB peers offering similar yields but with cleaner books. This slashes default risk by up to 20%, per the PIT analysis, without sacrificing spread.
- Alpha hunting: Manipulation distorts valuations and widely employed measures of default risk. Transparently's scores enable dynamic rebalancing: overweight low-risk issuers with sub-30 scores while underweighting issuers with middling scores. For passive ETFs like HYG or JNK, integrating these as overlays could evolve into "smart beta" vehicles, boosting Sharpe ratios. Active managers gain an edge in relative value trades, spotting mispricings where spreads are unjustified based on the scoring system.
- Risk mitigation at scale: High-yield portfolios often juggle hundreds of names; making manual forensics impossible. AI scores automate vigilance, triggering alerts for score deteriorations, which is vital in volatile sectors like energy or autos.
Let’s consider a real life example to examine these three ideas. Figure II illustrates a selection of the 10 of the more recent ratings announcements on sub-investment grade issuers drawn from the S&P Composite Index. The full universe of sub-investment grade issuers in the S&P typically includes between 25 and 35 companies, but this list of 10 is sufficient for illustration purposes. We are using the latest long-term issuer credit ratings from S&P Global or FitchRatings as of November 12, 2025.
Bear in mind that the high-yield universe has 11 grades ranging from BB+, the highest grade, all the way down to D, which is the lowest grade. Since companies in the S&P are large and well established, they tend to be investment grade. Those that aren’t, the fallen angels, are typically BB- or above. Companies with a single B rating tend not to remain in the S&P Composite Index for very long.
In a typical high-yield bond ETF, bonds in the BB- to BB+ range represent about half the universe.
Figure II: S&P rating and Transparently risk scores of select high-yield S&P 500 members
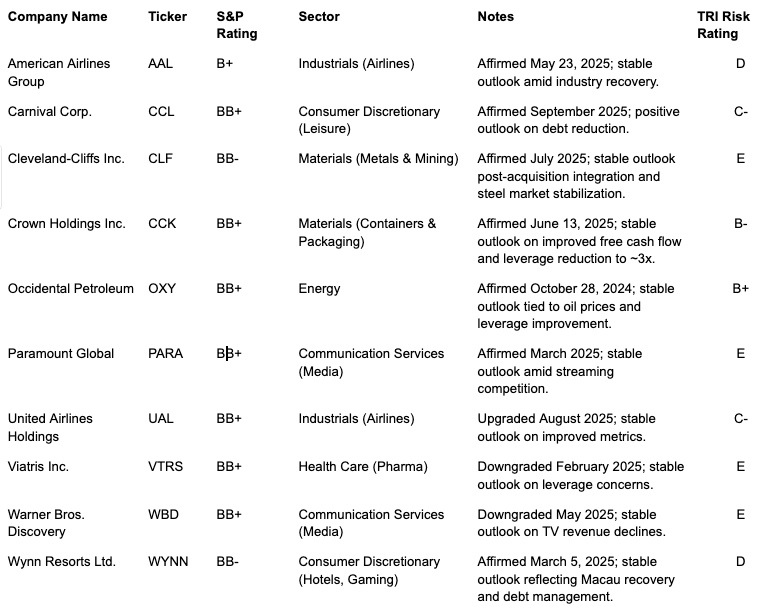
Screening Example: The TRI risk score provides a far more differentiated view of the default risk posed by these companies than the S&P Credit rating. While the bulk of these companies are rated in the BBs, the TRI ratings range from as high as B+, a very good rating, to as low as E, a deeply concerning rating. The TRI helps a cautious investor screen out the high-risk 'E' ratings like PARA/VTRS/WBD in favor of names like CCK/OXY, even though S&P rates them similarly.
Alpha generation example: CCK and OXY appear to warrant overweighting versus similarly rated names with a lower TRI rating, once again assuming broadly comparable yields. Such decisions are complex. By providing a more granular and data-driven assessment of a company's accounting quality and manipulation risk, forensic AI can help credit analysts make more informed decisions about the true risk associated with a particular issuer. This can lead to better pricing of risk and more robust portfolio construction.
Risk Mitigation example: Transparently’s forensic AI can continuously monitor the accounting quality of portfolio companies, alerting managers to any changes that could impact creditworthiness. VTRS and WBD, for example, both suffered downgrades in 2025.
Although WBD enjoyed an investment grade rating of BBB- until May 2025, the TRI risk rating rated the company at ‘F’ for both 2022 and 2023 was an ‘F’. This warning, coming years before the eventual downgrade to junk status, is typical.
Of course, sometimes the warning period can be significantly shorter. The TRI rating follows the accounts. The TRI awarded VTRS C- ratings in 2022 and 2023–not great but hardly dire. When the company announced its results on 27 February, 2025, however, the rating dropped alarmingly to ‘E’. A portfolio manager employing the TRI to monitor risk would have had sufficient warning to reduce holdings before S&P downgraded VTRS to junk the following day.
A more complete picture of credit risk
Critics might note that the TRI is fraud-centric and not a pure default model. For example, "collapse" can sometimes mean delisting without default. We’re not saying it's a silver bullet. Fixed income risks also include interest-rate shifts, duration mismatches, and macroeconomic factors, which this tool doesn't address. Moreover, it's equity-focused by design (analyzing public filers), so can’t help at this stage for private debt without disclosures.
But these objections miss the point, which is that the TRI gives investors a more complete picture of credit risk. The 90% collapse accuracy and return correlations provide robust substantiation, making it a viable adjunct to tools like Moody's or S&P ratings. For investors, it's arguably better than generic PD models for manipulation-heavy sectors like tech or energy.
In summary, the Risk Index's design as a manipulation-to-collapse predictor positions it squarely as a default forecasting aid, with strong evidence of real-world alpha and risk reduction. If deploying it, backtest against your holdings' default history for tailored validation.
Whether you're an ETF provider or institutional allocator, layering these risk scores into your strategy isn't just enhancement - it's essential evolution. The underperformance of active managers is testimony to the reality that traditional credit analysis often misses certain accounting irregularities or aggressive accounting practices. Forensic AI can uncover these hidden risks, which are particularly important in the high-yield space where companies may have weaker financial positions or less transparent reporting.
Ready to evolve your strategy and uncover the hidden risks your peers are missing? Contact us today for a personalized demo, or trial the Transparently API to put our risk score to the test on your portfolio's top holdings.