
Small-cap investing comes with inherent challenges, including limited analyst coverage, poor liquidity, and high volatility. Traditional research methods struggle to uncover the vast array of information needed to make informed decisions in this less-covered but numerous market.
On the flip side, reduced scrutiny means that the small cap universe offers the prospect of “hidden gems" – quality companies, often with significant growth potential, trading below their intrinsic value and offering an opportunity for significant returns as the market eventually recognizes their worth.
This is where AI comes into its own. Acting as a tireless researcher, AI models can augment human capabilities, sifting through massive datasets that human analysts simply cannot process. In doing so, AI can uncover overlooked opportunities and mitigate risks in this vast universe of companies.
Uses of unstructured data would include:
- News and social media sentiment: analyzing thousands of articles, tweets, and forums for early indicators of customer sentiment, product adoption, market shifts, or emerging trends impacting niche small-cap players;
- Regulatory filings and transcripts: quickly identifying key phrases, changes in risk factors, or tone shifts in earnings call transcripts that could signal future performance changes;
- Supply chain analysis: mapping and assessing the health of complex supply chains for smaller companies by analyzing shipping data, commodity prices, and partner announcements; and
- Competitive landscape: identifying new entrants, disruptive technologies, or shifts in competitive intensity specific to a small company's niche.
Uses of structured data would include:
- Financial health assessment: detecting subtle shifts in cash flow, debt levels, or inventory that might signal distress or fraud before they become obvious;
- Governance Issues: flagging potential governance red flags by analyzing executive compensation, board composition, and related-party transactions from public filings;
- Pattern recognition: overcoming human biases and limitations to identify non-obvious correlations and patterns across diverse datasets that influence stock performance;
- Predictive analytics: using quantitative edge to build models that forecast revenue, earnings, or market share based on hundreds of traditional and alternative data points (e.g., job postings, satellite imagery of facilities, web traffic);
- Factor-based investing: discovering new, robust factors beyond traditional value or growth that drive small-cap returns;
- Market microstructure: analyzing trading patterns and order book data to gain insights into liquidity and potential price movements.
AI augments human expertise, not replaces it
While human intuition, experience, and qualitative judgment remain crucial in small-cap investing, the reality is that human analysts have limited time and cognitive capacity, typically forcing them to focus on a very narrow set of companies in the small-cap space. Opportunities are lost simply because analysts have limited time.
AI serves as a powerful research assistant, automating the tedious and data-intensive aspects of analysis, and allowing analysts to work from a shortlist derived from a far larger universe of companies that meet specific criteria.
AI frees up human analysts to focus on higher-value qualitative analysis, especially management interviews which are so critical in small-cap analysis. More time is available for strategic decision-making, leading to more profound insights.
Transparently.ai is at the cutting edge of using both structured and unstructured data to assess financial health, highlight governance risks and use pattern recognition to identify non-obvious correlations and patterns that influence stock performance.
The Transparently Risk Engine (TRE) is able to sift thousands of small cap-companies according to a wide variety of criteria - for example by domicile, auditor, industry or country - and provide a quantitative ranking of companies according to their prospective accounting quality.
The question is, how much can the TRE potentially add to the returns of a small-cap manager? One such manager has already vouched for the system’s utility, but let’s dive into more detail.
We have previously illustrated the alpha-generating capacity of the TRE across the global stock universe. In that post, we showed that an ETF using the system to eliminate companies with worse than average accounting quality might be expected to generate something in the order of 150-to-200 basis points of additional return versus an ETF indexed to the market, enough to retire around 8 years earlier to more than double the retirement income of a person retiring at 65.
AI as a screening tool for small caps
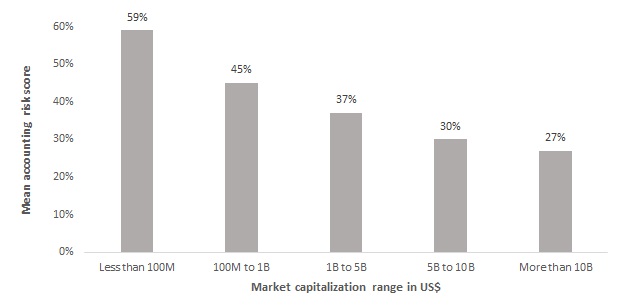
There is strong reason to expect that the return pick-up for small caps would be greater. The reason is that there is a clear inverse relationship between company size and risk score. Figure I illustrates the average risk score generated by the TRE for companies in different market capitalization ranges. Smaller companies (less than 100M market cap) show the highest mean risk score of 59%, while the largest companies (over 10B market cap) have the lowest mean score of 27%.
This pattern is consistent with financial theory, which suggests that smaller companies typically carry higher risk due to factors such as limited resources, less diversified business models, and greater vulnerability to market shocks.
Figure I: Average risk score by market capitalization
Since smaller companies tend to have higher risk than larger companies, it follows that any effort to screen out higher risk companies among small-caps will tend to screen out the highest risk companies in the market, it should have a greater impact on returns and an equivalent screen for the broader market.
This is indeed the case. Figure II is copied from a point in time analysis undertaken by Transparently.ai. This chart compares median future (subsequent) 1-month returns across risk bands and market cap segments. The focus on median future returns provides insights into the typical forward-looking performance of companies of different sizes depending on their TRE risk scores.
A lot of quantitative science lies behind this chart, all of which is explained in the Transparently PIT analysis (contact us for details). We shall simply focus on what the results indicate. All we shall say is these are the actual forward returns the model would have generated at each point in time. The data spans from 1999 to 2025.
Bars on the extreme left side of the chart show companies with the lowest risk (Band 1), while those on the extreme right show the companies with the highest risk (Band 10). A reading of, say, -0.01 on the vertical axis represents a 1-month forward return of -1% which equates to annualized return of -12.7%.
As we move from the leftmost bars to the rightmost bars the median 1-month forward return declines sharply. The median 1-month forward return of the lowest risk companies in Band 1 is a bit above 6% annualized. The median 1-month forward return of the highest risk companies in Band 10 varies between -28.9% annualized and -17.6% annualized.
This performance differential between the lowest and highest risk bands (i.e. between 23.6% and almost 30%) is enormous. It is akin to the speed difference between an F-22 Raptor and a Sopwith Camel.
Figure II: Median future 1-month return by risk band and market cap
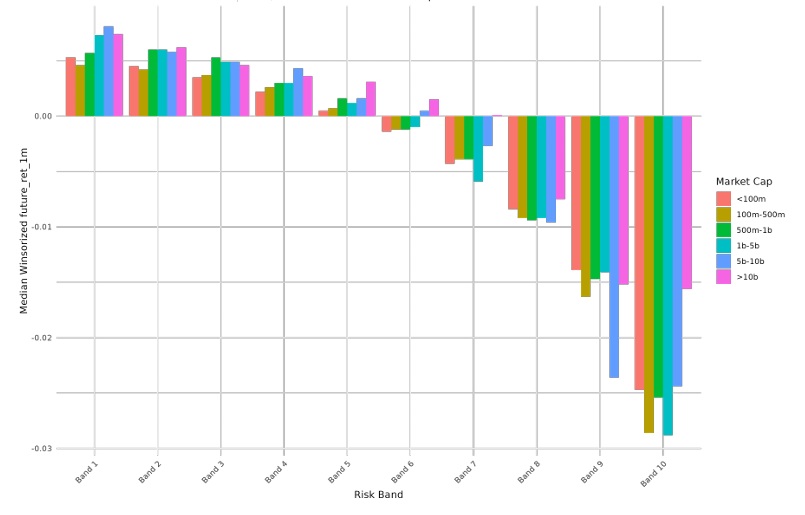
The different coloured bars represent different market capitalization ranges. The brownish and green bars on the left represent small caps with a market capitalization under $1 billion. These are the small-caps. The pinkish bars represent the large caps.
As can be seen in the chart, the low- versus high-risk return differential for small-caps is greater from small caps than for large caps. Were we to exclude the impact of the Chinese market from this analysis, the distinction between small and large companies would be even more extreme due to the incredibly poor performance of large Chinese companies with high risk scores.
More importantly, once we get beyond Band 5, in the small cap companies that have above average accounting risk, the median return is negative. Equally important, as we move from Band 1 to Band 10 the volatility of companies rises sharply. So in risk-adjusted terms, the deterioration in performance due to rising accounting risk is even more extreme than depicted in this chart.
Conclusion
The conclusion of the PIT analysis is very clear. A small-cap portfolio manager using their system could eliminate companies with a median expected annualized loss of around 25% by excluding Band 10 companies from consideration.
Excluding companies in Bands 9 and 8 would eliminate companies with a median expected annualized loss of around 15% and 8%, respectively. A manager focussed on companies within Bands 1 through 5 should begin their analysis expecting to significantly outperform the market.
Naturally, a manager using AI to perform some of the other tasks noted above should, a priori, have an even stronger possibility of outperformance, not least of which because the manager will have far more time to devote to meeting management, customers and competitors of companies being short listed.
AI is a no-brainer with a very large brain.